Quantitative Aptitude Quiz For Uttarakhand District Cooperative Banks Prelims
Directions (1-5): Study the following graph carefully to answer these questions.
The line graph shows the population of 2 states over a period of 6 years

Q1. For state B the percentage rise in population from the previous year was the highest in which of the following years?
Q2. What was the average population of state B (in million) for all the years together?
Q3. What is the per centage rise in population of state A in 2007 from the previous year?
Q4. What is the ratio between the total populations of states A and B respectively for all the years together?
Q5. Population of state A in 2005 is what per cent of its total population for all the years together?
Directions (6-10): What should come in place of the question mark (?) in the following questions(you are not expected to find exact value)?
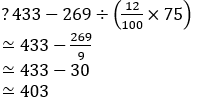
Q6.
Directions (11-15): What should come in place of question mark (?) in the following number series?
Q11. 32, 49, 83, 151, 287, 559, ?
Q12. 462, 552, 650, 756, 870, 992, ?
Q13. 15, 18, 16, 19, 17, 20, ?
Q14. 1050, 420, 168, 67.2, 26.88, 10.752, ?
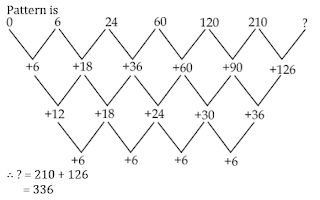
Q15. 0, 6, 24, 60, 120, 210, ?


 GA Capsule for SBI Clerk Mains 2025, Dow...
 The Hindu Review October 2022: Download ...
 LIC Assistant Salary 2025, Revised Basic...


