
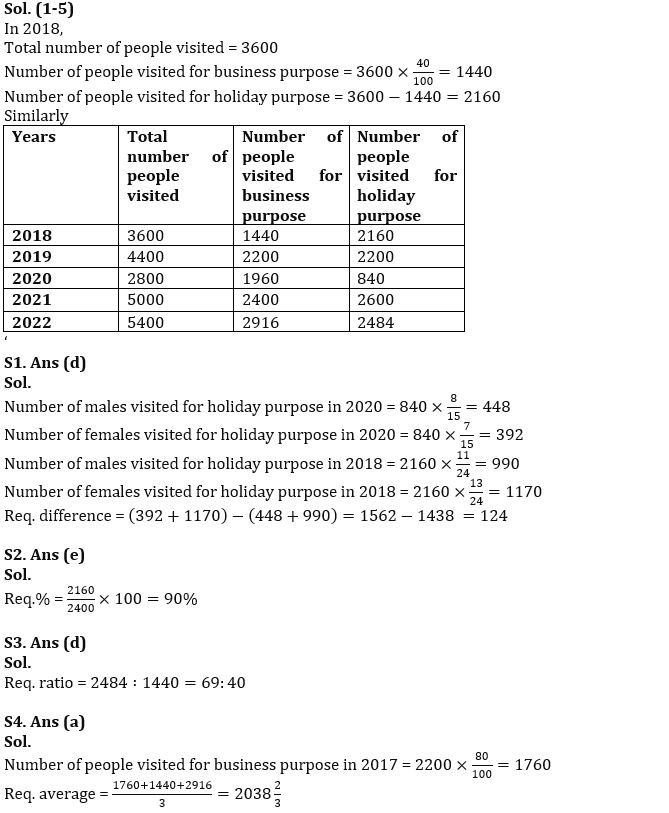
Directions (1-5): Read the following bar graph carefully and answer the questions given below. Bar graph show total number of people visited to country ‘P’ for two purposes i.e., business and holiday in five different years and it also shows percentage of number of people visited for business.
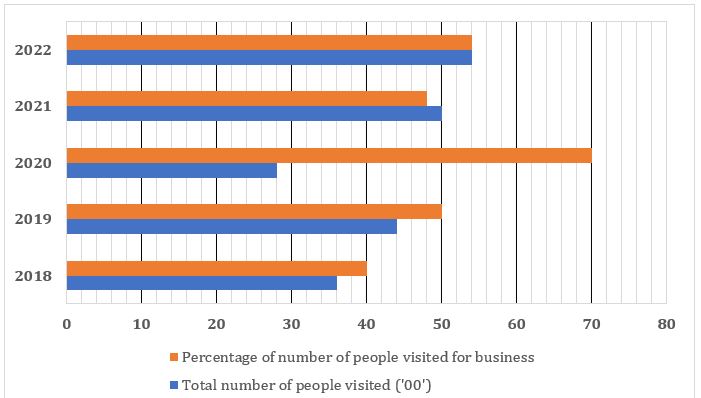
Q1. If ratio of males to females visited for holiday purpose in 2020 and 2018 is 8:7 and 11:13 respectively, then find the difference between number of males visited for holiday purpose in 2020 and 2018 together to number of females visited for holiday purpose in 2020 and 2018 together.
(a) 120
(b)144
(c) 108
(d) 124
(e) 156
Q2. Number of people visited for holiday purpose in 2018 is what percent of number of people visited for business purpose in 2021?
(a) 85%
(b) 80%
(c) 95%
(d) 70%
(e) 90%
Q3. Find the respective ratio between number of people visited for holiday purpose in 2022 to number of people visited for business purpose in 2018.
(a) 69:41
(b) 67:40
(c) 65:42
(d) 69:40
(e) 69:47
Q4. If number of people visited for business purpose in 2017 is 20% less than number of people visited for holiday purpose in 2019, then find the average number of people visited for business purpose in 2017, 2018 & 2022.
(a) 2038⅔
(b) 2035⅔
(c) 2038⅓
(d) 2032⅔
(e) 2039⅓
Q5. Number of people visited for holiday purpose in 2022 is how much more/less than average number of people visited for business purpose in 2019 and 2021 together.
(a) 180
(b) 184
(c) 194
(d) 162
(e) 148
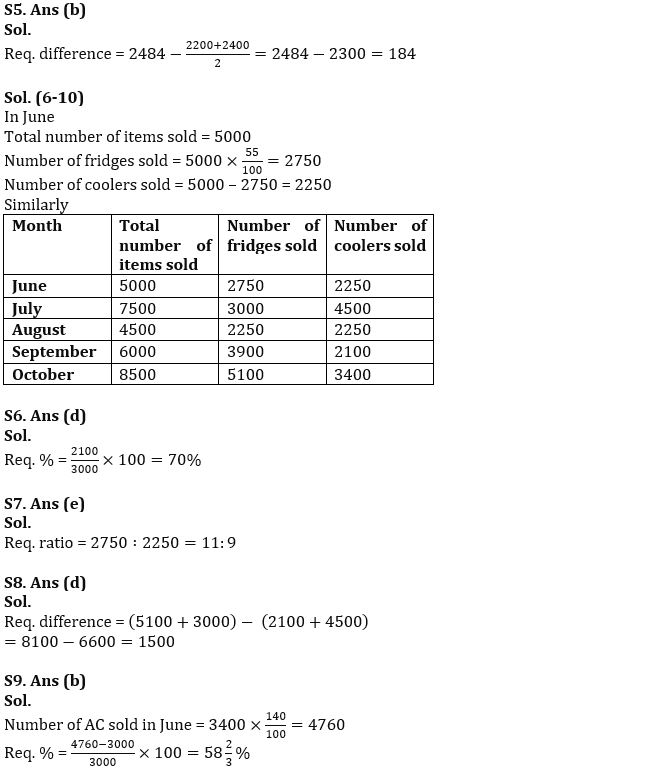
Directions (6-10): Read the following line graph carefully and answer the questions given below. Line graph shows total number of items (Fridge + Cooler) sold and percentage of number of fridges sold out of total items in five different months.
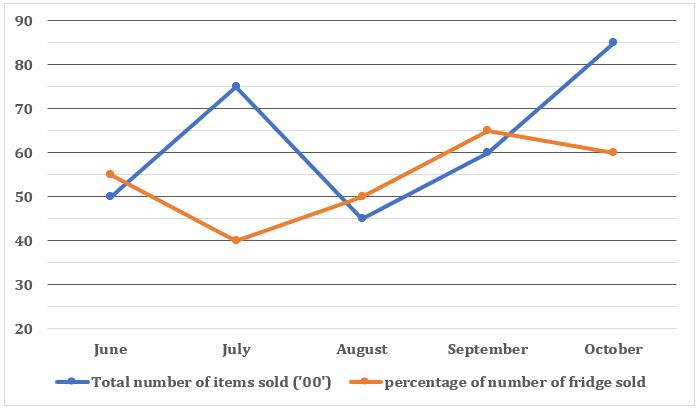
Q6. Number of coolers sold in September is what percentage of number of fridges sold in July?
(a) 20%
(b) 50%
(c) 30%
(d) 70%
(e) 80%
Q7. Find the ratio of number of fridges sold in June to number of coolers sold in August.
(a) 11:12
(b) 12:11
(c) 11:5
(d) 10:7
(e) 11:9
Q8. Find the difference between number of fridges sold in October and July together and number of coolers sold in September and July together.
(a) 1800
(b) 2500
(c) 2000
(d) 1500
(e) 1000
Q9. If number of AC sold in June is 40% more than number of coolers sold in October, then find number of AC sold in June is what percentage more/less than number of fridges sold in July.
(a) 55⅔%
(b) 58⅔%
(c) 60⅔%
(d) 50⅔%
(e) 66⅔%
Q10. Total number of items (Fridges + Coolers) sold in November is 50% more than that in August and ratio of number of fridges sold in September to that in November is 12:7 respectively. find the number of cooler sold in November.
(a) 4475
(b) 4485
(c) 4425
(d) 4470
(e) 4410
Direction (11 – 15): Bar chart given below shows percentage distribution of total number of male employees working in five different companies. Read the data carefully and answer the questions.
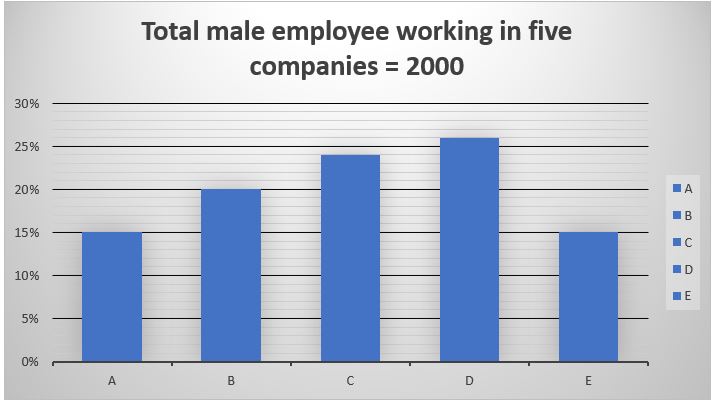
Q11. If total female employees working in ‘D’ are 37 ½ % less than total male employees working in B, then find ratio of male to female employees working in D respectively?
(a) 52 : 27
(b) 52 : 25
(c) 52 : 23
(d) 52 : 29
(e) 25 : 52
Q12. If ratio of total male employees to female employees working in E is 6 : 5, then find total female employees working in E is what percent (approximate) of total male employees working in C?
(a) 52%
(b) 56%
(c) 62%
(d) 48%
(e) 60%
Q13. Find the average number of male employees working in companies A, C & E?
(a) 480
(b) 300
(c) 320
(d) 360
(e) 420
Q14. If total employees working in company F are 12.5% more than total male employees working in company D and ratio of male to female employees working in F is 2 : 1, then find total male employees working in F is what percent less than the total male employees working in B?
(a) 0.25%
(b) 5%
(c) 2.5%
(d) 2%
(e) None of these
Q15. Find the difference between total male employees in A & D together and total male employees in C?
(a) 380
(b) 420
(c) 320
(d) 340
(e) 360
Solutions


 Data Interpretation Questions for SBI PO...
 Data Interpretation Questions For Bank E...
 Quantitative Aptitude Quiz For Bank Main...