
Table of Contents
Directions (1-5): Given below line graph shows total number of students (Hosteler + Day scholar) in five different years in a college ‘A’, also shows total number of Day scholar students. Read the data carefully and answer the questions.
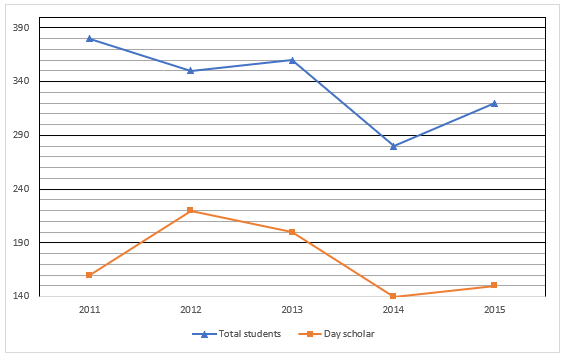
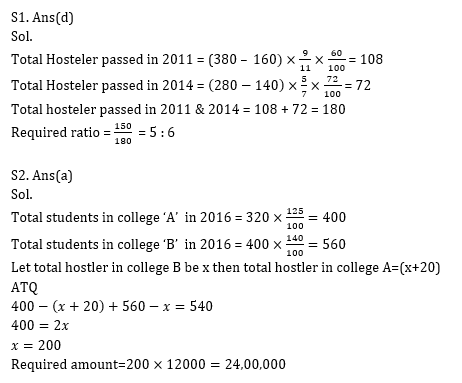
Q1. 9/11 th of total hosteler in 2011 and 5/7 th of total hosteler in 2014 appeared in exam. If 60% of appeared hosteler in exam in 2011 & 72% of appeared hosteler in exam in 2014 passed the exam, then find ratio of total day scholar in 2015 to total hosteler passed in 2011 & 2014 together?
(a) 5 : 7
(b) 5 : 9
(c) 5 : 8
(d) 5 : 6
(e) 5 : 4
Q2. In 2016 in college A total students are 25% more than previous year, and total students in college ‘B’ in 2016 are 40% more than that of total students in college ‘A’ in same year. If sum of day scholar in the both colleges are 540 and total hostler in college ‘A’ are 20 more than total hostler in college ‘B’ and each hostler annual fee in college ‘B’ in the year 2016 is Rs. 12000, then find total amount hostler paid in college ‘B’(in Rs.)?
(a) 24,00,000
(b) 22,00,000
(c) 20,00,000
(d) 30,00,000
(e) None of these
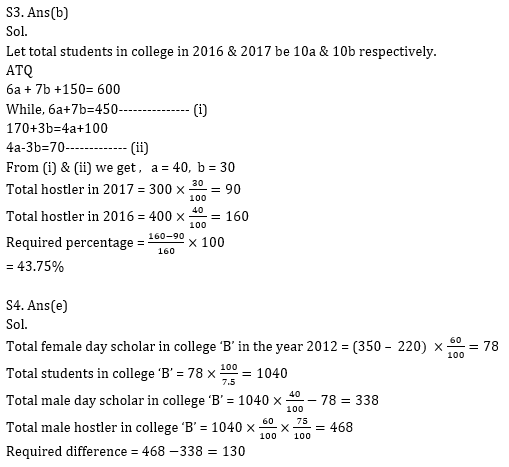
Q3. Sum of total day scholar in the year 2015, 2016 & 2017 is 600 and total hostler in the year 2015 & 2017 together is 100 more than total hostler in the year 2016. If total day scholar in 2016, 2017 is 60% & 70% of total students in college, then find total hostler in 2017 is what percent less than total hostler in 2016?
(a) 41.25%
(b) 43.75%
(c) 43.25%
(d) 44.75%
(e) 42.25%
Q4. In college ‘B’ in the year 2012 40% are day scholar and total female day scholar in that year in college ‘B’ is 60% of total hostler in college ‘A’ in the year 2012. If total female day scholar in 2012 is 7.5% of total students in college ‘B’ and 25% of total hostler are female, then find difference between total male hostler and total male day scholar in college ‘B’ in the year 2012?
(a) 120
(b) 110
(c) 105
(d) 140
(e) 130
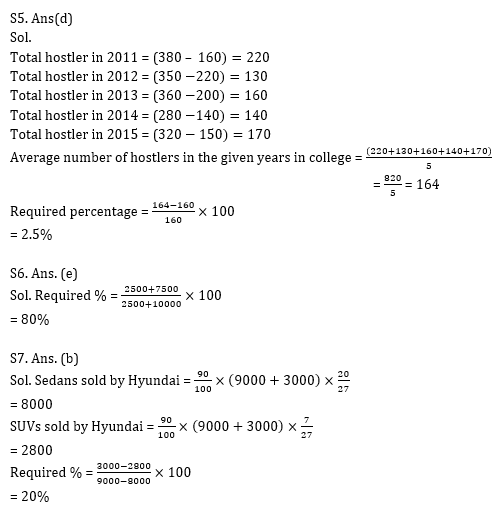
Q5. Average number of hostlers in the given years in college are what percent more than total hostler in the year 2013?
(a) 1.5%
(b) 2%
(c) 1%
(d) 2.5%
(e) 3.5%
Directions (6-10): Study the line chart given below carefully and answer the following questions.
Line chart shows the number of sedans and SUVs manufactured by five different companies (Mahindra, Toyota, Hyundai, Jeep and Honda) in 2018.
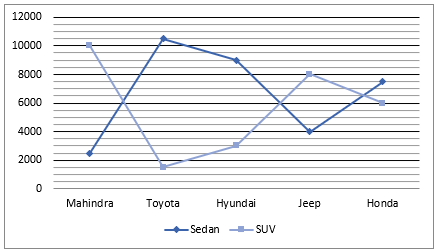
Note – Total cars manufactured by any company = Total (sedans + SUVs) manufactured by that company.
Q6. Sedans manufactured by Mahindra and Honda together are what percent of total cars manufactured by Mahindra?
(a) 110%
(b) 100%
(c) 120%
(d) 90%
(e) 80%
Q7. If Hyundai sold 90% of the cars manufactured by it and ratio of sedans sold by Hyundai to SUVs sold by Hyundai is 20 : 7, then find unsold SUVs of Hyundai are what percent of unsold sedans of Hyundai?
(a) 28%
(b) 20%
(c) 44%
(d) 35%
(e) 39%
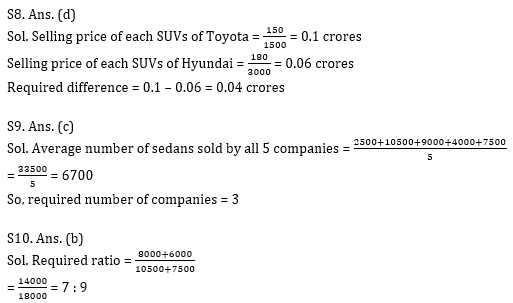
Q8. If revenue of Toyota and Hyundai from sales of SUVs is Rs.150 crores and Rs.180 crores, then find difference between selling price of each SUVs of Toyota and Hyundai. (Consider both companies sold all SUVs manufactured by them).
(a) 0.08 crores
(b) 0.05 crores
(c) 0.03 crores
(d) 0.04 crores
(e) None of the above.
Q9. For how many companies, sedans sold by them are more than average number of sedans sold by all 5 companies?
(a) 1
(b) 2
(c) 3
(d) 4
(e) 5
Q10. Find ratio of SUVs sold by Jeep and Honda together to sedans sold by Toyota and Honda together.
(a) 3 : 4
(b) 7 : 9
(c) 11 : 15
(d) 5 : 8
(e) 1 : 2
Directions (11-15): Given below line graph shows total sold cycle of five different companies (in %) out of total manufactured cycle in two years. Total manufactured cycle by a company is same for both the years.
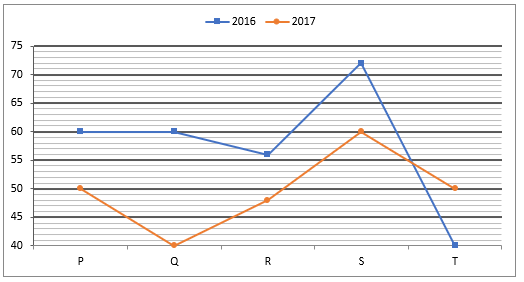
Note – Manufactured cycles = Sold cycles + Unsold cycles
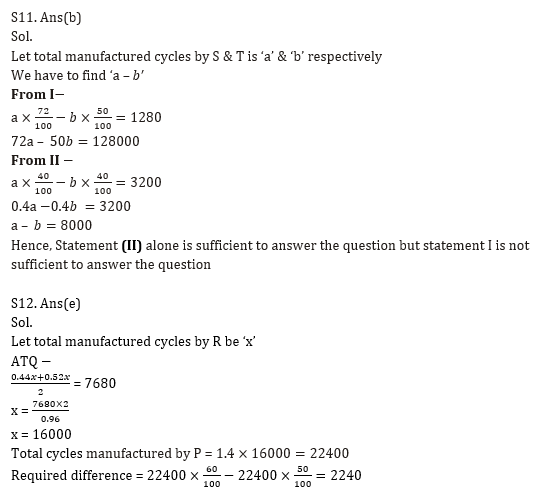
Q11. Find the difference between total manufactured cycles by S & T?
- Difference between cycles sold by S in 2016 and unsold cycles by T in 2017 is 1280.
- Difference between total unsold cycles by S in 2017 and total sold cycles by T in 2016 is 3200.
(a) Statement (I) alone is sufficient to answer the question but statement (II) alone is not sufficient to answer the questions.
(b) Statement (II) alone is sufficient to answer the question but statement (I) alone is not sufficient to answer the question.
(c) Both the statements taken together are necessary to answer the questions, but neither of the statements alone is sufficient to answer the question.
(d) Either statement (I) or statement (II) is sufficient to answer the question.
(e) Statements (I) and (II) together are not sufficient to answer the question.
Q12. If average unsold cycles in R in both the years is 7680 and total manufactured cycle by P is 40% more than total that of R, then find difference between total Sold cycles by P in both the years?
(a) 2280
(b) 2260
(c) 2200
(d) 2220
(e) 2240
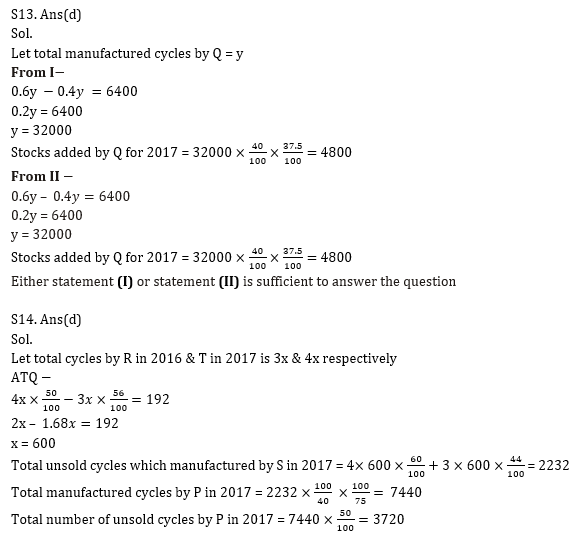
Q13. If out of total unsold cycles some cycles were added as stock for next year, then find the stocks added by Q for 2017.
- Stocks added by Q for 2017 is 62.5% less than total sold cycles by Q in 2017, while difference between total sold cycles by Q in both the years is 6400.
- Q added 37.5% of its total unsold cycles in 2016 for 2017, while difference between total sold cycles by Q in both the years is 6400.
(a) Statement (I) alone is sufficient to answer the question but statement (II) alone is not sufficient to answer the questions.
(b) Statement (II) alone is sufficient to answer the question but statement (I) alone is not sufficient to answer the question.
(c) Both the statements taken together are necessary to answer the questions, but neither of the statements alone is sufficient to answer the question.
(d) Either statement (I) or statement (II) is sufficient to answer the question.
(e) Statements (I) and (II) together are not sufficient to answer the question.
Q14. Ratio of total manufactured cycles by R in 2016 & T in 2017 is 3 : 4 and difference between total sold cycles by R in 2016 & T in 2017 is 192. If total unsold cycles which manufactured by S in 2017 is equal to total unsold cycles by R & T in 2016 together, then find total number of unsold cycles by P in 2017, given total manufactured cycles by S in 2017 is 75% of total manufactured cycles P in same years.
(a) 3700
(b) 3680
(c) 3580
(d) 3720
(e) 3820
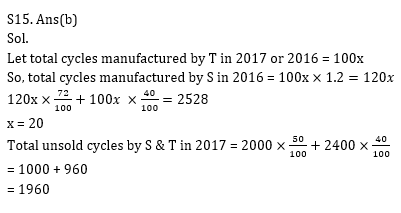
Q15. If total cycles manufactured by S in 2016 is 20% more than that of T in 2017 and sum of total sold cycles by both companies in the year 2016 is 2528, then find total unsold cycles by both the companies in the year 2017.
(a) 1800
(b) 1960
(c) 1600
(d) 1400
(e) 1500
Practice More Questions of Quantitative Aptitude for Competitive Exams:
Solutions
Practice with Crash Course and Online Test Series for IBPS PO/RBI Assistant 2020:
- RBI Assistant Mains 2020 Online Test Series
- IBPS PO Online test series (Prelims + Mains) 2020 by Adda247
- IBPS KA MAHAPACK Online Live Classes
Click Here to Register for Bank Exams 2020 Preparation Material


 GA Capsule for SBI Clerk Mains 2025, Dow...
 The Hindu Review October 2022: Download ...
 LIC AAO Salary 2025, Revised Structure, ...