
Direction (1 – 5): Pie chart given below shows distribution ( in degree and in absolute value) of savings of five persons (P, Q, R, S & T) and bar graph shows percentage of expenditure of these five persons. Read the data carefully and answer the questions.
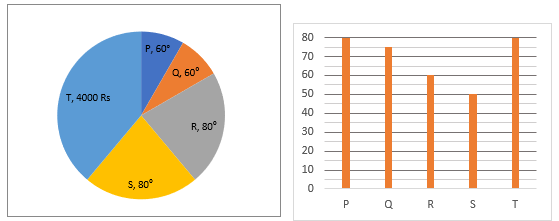
Note – Total income of any person = Total (saving + expenditure) of that person.
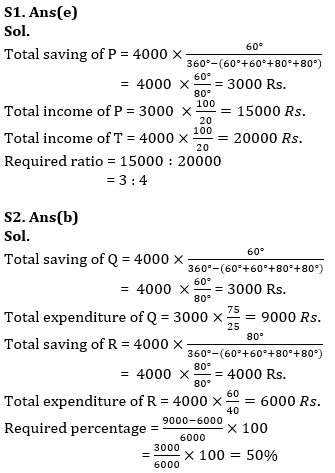
Q1. Find ratio of income of P to that of T?
(a) 3 : 2
(b) 2 : 3
(c) 3 : 5
(d) 4 : 3
(e) 3 : 4
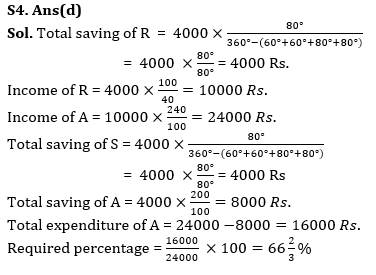
Q2. Total expenditure of Q is what percent more than that of R?
(a) 40%
(b) 50%
(c) 55%
(d) 30%
(e) 48%
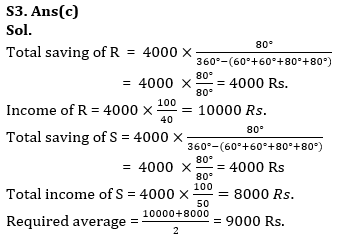
Q3. Find average income of R & S?
(a) 10000 Rs.
(b) 8000 Rs.
(c) 9000 Rs.
(d) 7000 Rs.
(e) 5000 Rs.
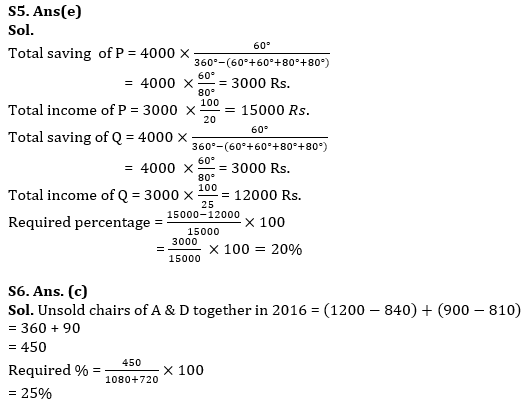
Q5. Income of Q is what percent less than that of P?
(a) 10%
(b) 22.5%
(c) 30%
(d) 25%
(e) 20%
Directions (6-10): Study the line chart and table given below and answer the following questions.
Line chart shows the number of chairs manufactured by 4 different chair manufacturers (A, B, C & D) in 2016 & 2017 and table shows the number of chairs sold by these manufacturers in 2016 & 2017.
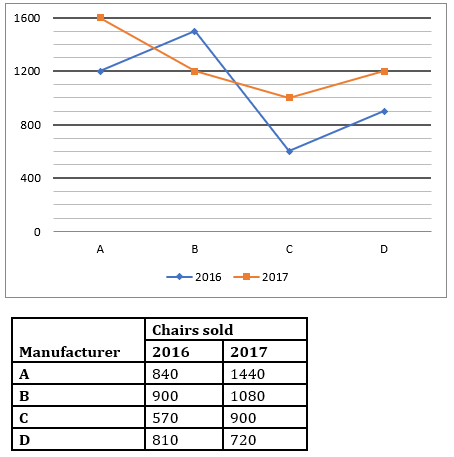
Note – Total chairs manufactured by any manufacturer in any year = Total chairs (sold + unsold) of that manufacturer in that year.
Q6. Unsold chairs of A & D together in 2016 are what percent of sold chairs of B & D together in 2017?
(a) 75%
(b) 40%
(c) 25%
(d) 55%
(e) 60%
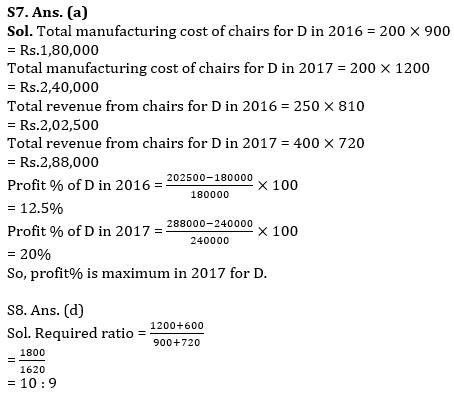
Q7. If manufacturing cost of a chair for D in 2016 & 2017 is Rs.200 and selling price of a chair for D in 2016 & 2017 is Rs.250 and Rs.400 respectively, then find profit% is maximum in which year among 2016 & 2017 for D? (D destroyed all the unsold chairs in these 2 years)
(a) Maximum in 2017
(b) Maximum in 2016
(c) Equal in 2016 & 2017
(d) None of these
(e) Cannot be determined
Q8. Find ratio of chairs manufactured by A & C together in 2016 to chairs sold by C & D together in 2017.
(a) 7 : 5
(b) 11 : 5
(c) 12 : 7
(d) 10 : 9
(e) 5 : 3
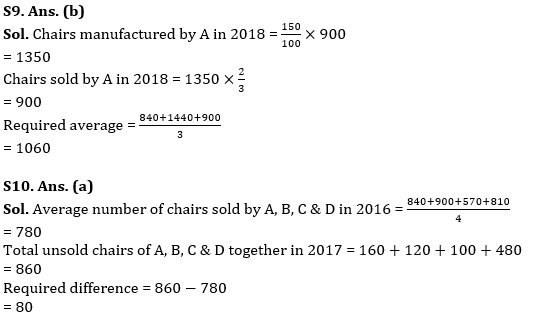
Q9. If chairs manufactured by A in 2018 are 50% more than chairs sold by B in 2016 and ratio of sold to unsold chairs of A in 2018 is 2: 1, then find average of chairs sold by A in 2016, 2017 & 2018.
(a) 1150
(b) 1060
(c) 1200
(d) 1170
(e) 1030
Q10. Find average number of chairs sold by A, B, C & D in 2016 is how much more or less than total unsold chairs of A, B, C & D together in 2017?
(a) 80
(b) 160
(c) 350
(d) 190
(e) 270
Solutions


 Quantitative Aptitude Quiz For Bank Main...
 Quantitative Aptitude Quiz For Bank Foun...