
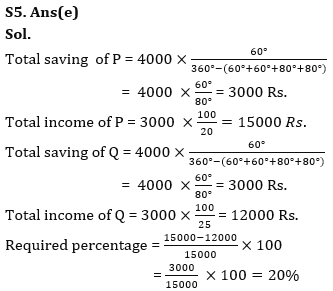
Direction (1 – 5): Pie chart given below shows distribution (in degree and in absolute value) of savings of five persons (P, Q, R, S & T) and bar graph shows percentage of expenditure of these five persons. Read the data carefully and answer the questions.
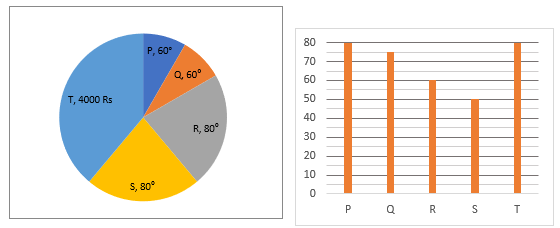
Note – Total income of any person = Total (saving + expenditure) of that person.
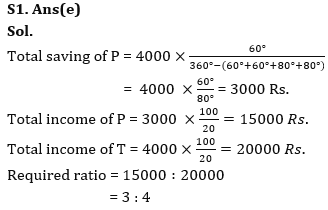
Q1. Find ratio of income of P to that of T?
(a) 3 : 2
(b) 2 : 3
(c) 3 : 5
(d) 4 : 3
(e) 3 : 4
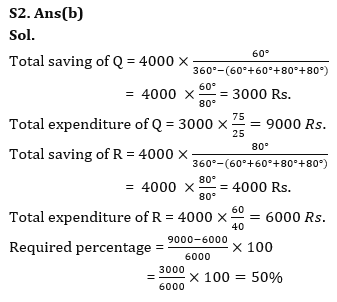
Q2. Total expenditure of Q is what percent more than that of R?
(a) 40%
(b) 50%
(c) 55%
(d) 30%
(e) 48%
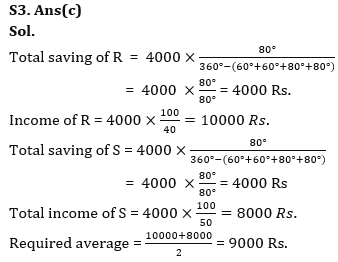
Q3. Find average income of R & S?
(a) 10000 Rs.
(b) 8000 Rs.
(c) 9000 Rs.
(d) 7000 Rs.
(e) 5000 Rs.
Q5. Income of Q is what percent less than that of P?
(a) 10%
(b) 22.5%
(c) 30%
(d) 25%
(e) 20%
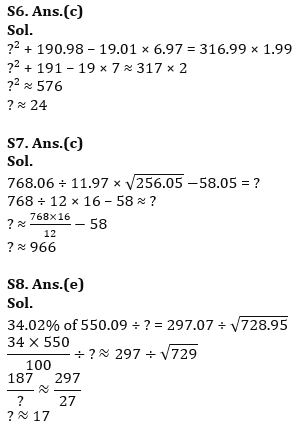
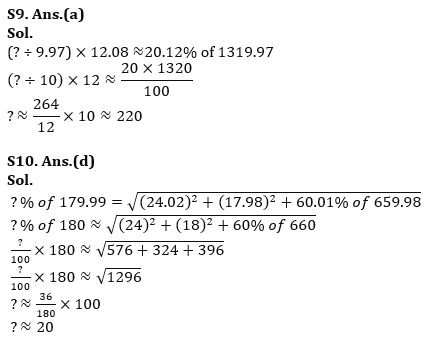
Directions (6-10): What approximate value will come in place of question mark (?) in the given questions: (You are not expected to calculate the exact value.)
Q9. (? ÷ 9.97) × 12.08 = 20.12% of 1319.97
(a) 220
(b) 240
(c) 260
(d) 280
(e) 200
Solutions

 . .
. .

 Quantitative Aptitude Quiz For Bank Main...
 Quantitative Aptitude Quiz For Bank Foun...