Directions (1-5): The following pie-chart shows the no. of persons (in degree) who were awarded for their bravery and intelligence during critical conditions in the year 2017 in various states. Study the graph carefully to answer the following question. Note: Some data in pie-chart are in degree and some are in absolute value.

Q1. Find the total no. of person who were awarded for their bravery and intelligence in the state UP, Maharashtra and West Bengal together.
Q2. Total persons who were awarded for their bravery and intelligence in states Haryana and Kerala together are what percent more or less than that in state Maharashtra?
Q3. If ratio of male to female who were awarded for their bravery and intelligence in states MP and west Bengal be 2 : 1 and 1 : 2 respectively then total females of MP are approximately what percent more or less than the total females of west Bengal who were awarded?
Q4. Find the average no. of persons who were awarded for their bravery and intelligence in states UP, MP and Kerala together.
Q5. What is the difference between total no. of persons who were awarded in states MP, Maharashtra and Haryana together and total no. of persons who were awarded in states UP, Kerala and West Bengal together?
Directions (6-10): The following pie-chart shows the distribution of chocolates (in degree) among children of different classes of Bal Bharti School. Study the chart carefully to answer the following questions. Note: Some data are in degree while some data are in absolute value in the following chart.

Q6. Total no. of chocolates distributed among class V students is what percent of total chocolates distributed among class VI students (approximately)?
Q7. If ratio of boys to girls in class I be 3 : 1 and each student get two chocolate then how many boys are there in class I who got Chocolates?
Q8. What is the average no. of Chocolates distributed among students of class II and III together?
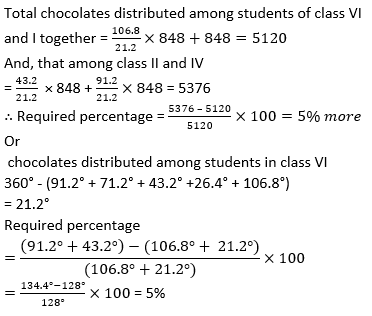
Q9. Total Chocolates distributed among students of class II and class IV together is what percent more or less than the total no. of chocolates distributed among students of class VI and I together?
Q10. What is the difference between total chocolates distributed among students of class I, II and VI together and total chocolates distributed among students of class III, IV and V together?
Directions (11-15): The following pie chart shows the distribution of passengers travelling from 5 different buses from Delhi to Shimla. Study the pie chart and answer the following questions.

Q11. Find the average number of passengers traveling from SPS travels, SRS travels and Neeta travels
Q12. If male and female traveling from Neeta travels and SRS travels are in ratio 2 : 3 and 3 : 2 respectively than find the female passengers travelling from SRS travel and Neeta travels together.
Q13. Find the central angle made by Saini travels in the given pie chart.
Q14. Passengers travelling from Neeta travels are how much percent more than average no. of passengers travelling from SPS travels and Noor travels together?
Q15. If 25% of Saini travels passengers would travel from Noor travel in place of Saini travel. Then find the ratio of passenger travelling from Noor and Neeta travels together to SRS travels and Saini travels together.


 GA Capsule for SBI Clerk Mains 2025, Dow...
 The Hindu Review October 2022: Download ...
 NAL Technical Assistant Recruitment 2025...


