Table of Contents
The SBI PO exam will be conducted soon, and candidates should focus on the key areas to strengthen their preparation. An important section in the exam is Data Interpretation (D.I.), which consistently carries significant weight. To help boost your preparation, we have designed Data Interpretation Questions for SBI PO Exam, complete with detailed solutions. This will enable you to improve your problem-solving skills and approach the exam with confidence.
SBI PO: Data Interpretation Questions Asked in Last 3 Years
Below are some Data Interpretation Questions which were asked in the SBI PO Exam in the Last 3 years.
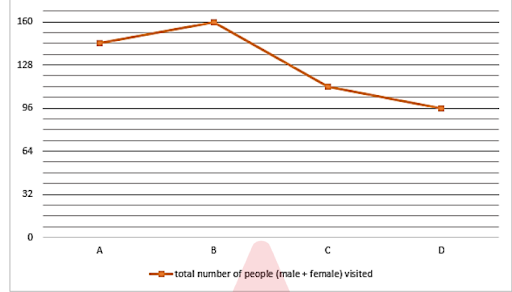
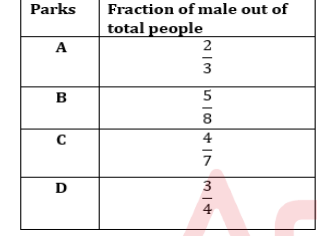
Directions (1-6): The line graph given below shows total number of people (male + female) visited four different parks (A, B, C and D) and table shows fraction of male out oftotal people visited these four parks. Read the data carefully and answer the questions below.
Q1. If total number of females visited park E are 75% of total number of males visited park A & C
together and total number of males visited park E are 25% more than total females visited park C,
then find total people visited park E.
(a) 200
(b) 140
(c) 160
(d) 120
(e) 180
Q2. The ratio local and outside people visited park B is 7 : 1 respectively, while the ratio of total
local and outside females visited park B is 5 : 1 respectively. Find the ratio of outside to local males
visited park B.
(a) 1 : 5
(b) 3 : 7
(c) 1 : 7
(d) 1 : 9
(e) 1 : 8
Q3. Find the difference between average number of females visited park A, C & D and total number
of males visited park B.
(a) 30
(b) 40
(c) 60
(d) 70
(e) 80
Q4. If there is discount of 20% on each ticket for females as compare to male and total revenue
received by park D from all the people is Rs 2280, then find the price of each ticket for female.
(a) 20 Rs
(b) 25 Rs
(c) 24 Rs
(d) 12 Rs
(e) 30 Rs
Q5. If average number of females visited park A, B & F are 60, then find total number of females
visited park F are what percent of total number of males visited park A.
(a) 55%
(b) 100%
(c) 80%
(d) 60%
(e) 75%
Q6. Total number of females visited park A and D together is what percent more than total number
of females visited park B.
(a) 15%
(b) 10%
(c) 20%
(d) 5%
(e) 25%
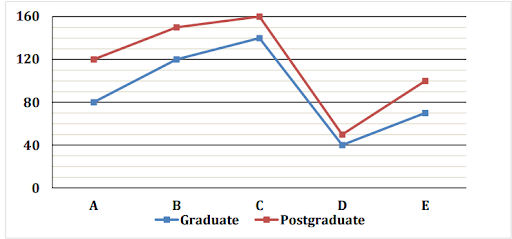
Directions (7-11): Line chart shows the number of graduate students and postgraduate students in five different colleges (A, B, C, D & E). Study the line chart given below and answer the following questions.
Q7. Total number of students (graduate + postgraduate) in collage A in together are what percent more or less than total postgraduate students in collage B & collage E together?
(a) 80%
(b) 30%
(c) 50%
(d) 20%
(e) 60%
Q8. If ratio of boys to girls in graduate students and postgraduate students in collage C is 3:2 & 5:3 respectively, then find ratio of total number of boys in graduate students and postgraduate students in collage C together to total number of graduate students in collage B?
(a) 7 : 5
(b) 23 : 15
(c) 3 : 2
(d) 21 : 13
(e) 4 : 3
Q9. Total number of graduates students in collage C & collage E together are what percent of total graduate students and postgraduate students in collage D?
(a) 233 1/3%
(b) 266 2/3%
(c) 250%
(d) 225%
(e) 275%
Q10. If total graduate students in collage X are 90 more than total graduate students in collage E and ratio of boys to girls in graduate students in collage B & collage X is 11 : 9 and 3 : 7 respectively, then find number of girls in graduate students in collage B & X together?
(a) 145
(b) 128
(c) 134
(d) 166
(e) None of the above.
Q11. The average number of students postgraduate students in collage B, C & D are how much more or less than graduate students in collage A & E together?
(a) 10
(b) 20
(c) 30
(d) 50
(e) 40
Direction (12 – 16): Given bar graph shows percentage distribution of total CD’s ordered by four shopkeeper (A, B, C & D) and percentage of CD’s sold by these four shopkeepers out of total CD’s ordered by each. Read the data carefully and answer the questions.
Total CD’s ordered by all four shopkeepers together = 600
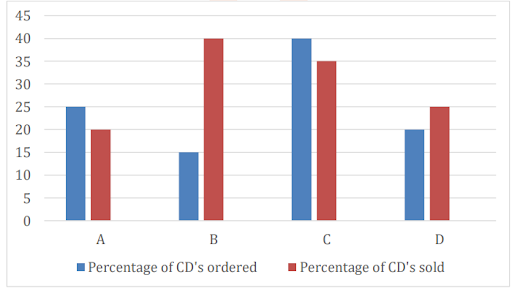
Q12. Total unsold CD’s by A & D together are how much more than total sold CD’s by C?
(a) 126
(b) 132
(c) 128
(d) 116
(e) 118
Q13. If total CD’s sold by shopkeeper E are 125% more than total CD’s sold by B and shopkeeper E sold 27% of total ordered CD’s, then find total CD’s ordered by E are what percent more than total CD’S ordered by C ?
(a) 36%
(b) 15%
(c) 30%
(d) 20%
(e) 25%
Q14. Find average number of unsold CD’s by B, C & D?
(a) 120
(b) 100
(c) 80
(d) 110
(e) 72
Q15. Find ratio of total CD’s sold by A & D together to total CD’s sold by B?
(a) 5 : 3
(b) 3 : 5
(c) 5 : 4
(d) 5 : 6
(e) 4 : 5
Q16. If total CD’s ordered by shopkeeper X is 100% more than total unsold CD’s by D and X sold 30% of total ordered CD’s, then find unsold CD’s by X are what percent of unsold CD’s by A?
(a) 105%
(b) 110%
(c) 100%
(d) 96%
(e) 90%
Data Interpretation Questions for SBI PO Exam
The Data Interpretation (D.I.) section is an important component of the SBI PO 2025 exam, and it provides a great opportunity to score good marks. Usually, this section consists of about 10 to 15 questions, making it an important area to master. Regular practice with different types of data sets such as bar graphs, pie charts, tables, and line graphs will greatly improve your problem-solving speed and accuracy. By honing your skills in D.I., you can increase your chances of scoring high marks in the SBI PO exam.
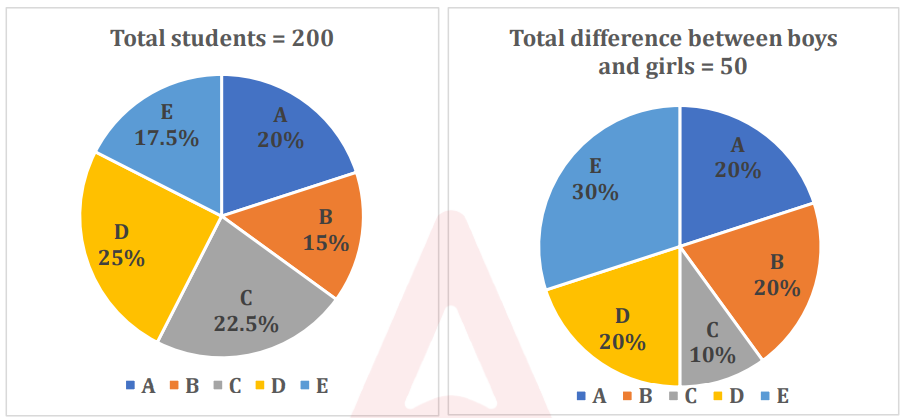
Direction (1 –5) : Pie Chart (I) shows percentage distribution of total number of students in five different schools and pie chart (II) shows percentage distribution of total difference between number of boys and girls in these five schools. Read the data carefully and answer the questions.
Q1. When one student from each A & C chosen as class monitor, then find the probability of both class monitors being boys (boys > girls, for both the schools)?
(a) 35/72
(b) 5/9
(c) 25/84
(d) 25/72
(e) 25/56
Q2. If five students from each B & D are chosen for representing their respective school in a debate competition, then find the maximum possible probability of girls in remaining students?
(a) 2/3
(b) 8/15
(c) 4/7
(d) 3/5
(e) 4/15
Q3. Number of boys in school F are 5 less than that of in E and number of girls in F are same as E. Find probability of selecting 1 boy & 1 girl from school – F.
(Boys > girls, in school E)?
(a) 40/87
(b) 14/29
(c) 43/87
(d) 2/3
(e) 16/29
Q4. Ratio of number of boys to girls left school A is 1 : 2 and when two students chosen from remaining students of school A, then probability of both being boys or both being girl is 11/18 . Find difference between number of boys and girls who left the school A (Boys > girls, in school A)?
(a) 6
(b) Can’t be determined
(c) 1
(d) 4
(e) 2
Q5. Ritu invested her total saving in three different FD schemes A, B and C in the ratio of 5 : 4 : 6 on CI for two years at the rate of 10%, 15% and 20% respectively. If interest is calculated annually and interest from scheme B is Rs. 744 more than interest from scheme A then, find difference between interest received from scheme C and scheme B by Ritu?
(a) Rs. 4185
(b) Rs. 4175
(c) Rs. 3840
(d) Rs. 4580
(e) Rs. 3250
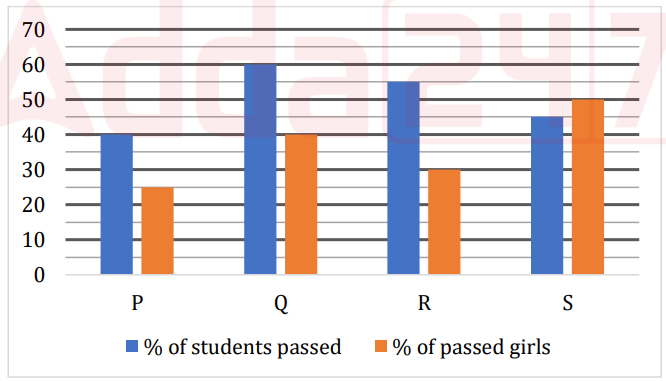
Direction (6 – 10) : Bar graph given below shows percentage of students passed out of total students in four different schools and percentage of girls passed out of total passed students in these four different schools in annual exam. Read the data carefully and answer the questions
Q6. Total boys passed from P is 900 and total girls failed from Q is 640. If total girls failed from Q is 36% less than of total students failed from Q, then find ratio of total students participated in exam from Q to that of from P?
(a) 5 : 9
(b) 5 : 7
(c) 3 : 5
(d) 5 : 6
(e) 4 : 7
Q7. Total boys failed from school Q is 60% of total students failed from that school and total boys passed from same school is 1440. Total failed boys from R is 192 more than total female passed from same school. Find difference between total girls failed from Q & R, if boys failed from R is 42% less than total students failed from R.
(a) 272
(b) 242
(c) 252
(d) 240
(e) 262
Q8. If total number of girls passed from S is 1125 and total failed boys are 133 1/3 % more than that of total failed girls from same school, then find difference between number of failed boys and failed girls from school S?
(a) 1100
(b) 1000
(c) 1110
(d) 900
(e) 1200
Q9. If difference between passed boys and passed girls from P is 600 and total boys passed from S is 1350, then find total failed students from S is what percent more than total students participated from school P ?
(a) 15%
(b) 10%
(c) 12%
(d) 5%
(e) 20%
Q10. Total students participated in exam from school R is 50% more than that of from P and difference between passed boys from both the school is 2220, then find average number of girls passed from both the schools?
(a) 1100
(b) 1000
(c) 1390
(d) 900
(e) 1200
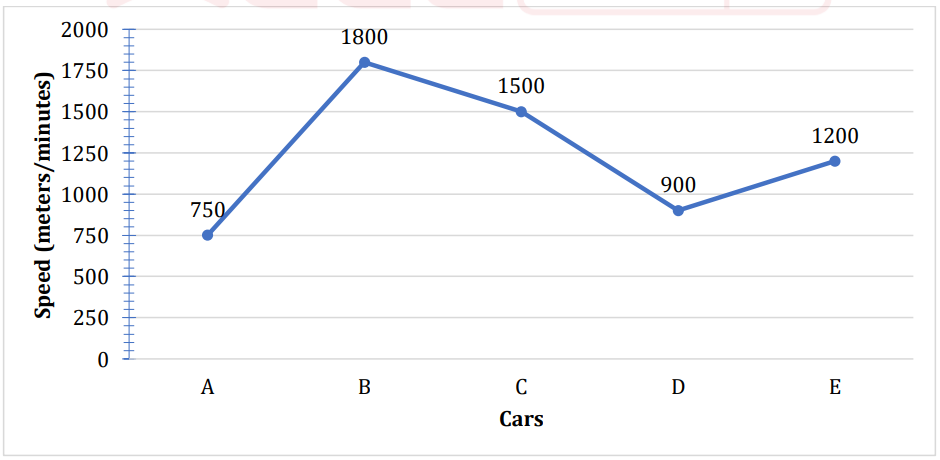
Directions (11-15): Line graph shows usual average speed of five cars A, B, C, D and E. Speed is given in meter/minute. Answer the question according to given data.
Q11. Car D started from Lucknow to Delhi at its usual speed for first half distance, but after that due to some problem in engine car travel at 4/6 of its usual speed. If car completed whole journey in 10 hr, then find the total distance between Lucknow and Delhi?
(a) 440 km
(b) 432 km
(c) 442 km
(d) 450 km
(e) 452 km
Q12. Car C starts from Pune and at the same time Car A starts from Mumbai towards each other, and at the time both meet one car has traveled 180 km more than other car. Find the distance between Pune and Mumbai?
(a) 540 km
(b) 520 km
(c) 500 km
(d) 520 km
(e) 640 km
Q13. Rajeev go to his village from the city by car B and return by car C. If his total travelling time is of 11 hours, then find the distance between city and his village?
(a) 500 km
(b) 510 km
(c) 520 km
(d) 540 km
(e) 1080 km
Q14. Car E travels at its usual speed between city X and Y and take 480 minutes to complete total distance. But at the time of returning car E decreases its speed by 12 km/hr. Then find time taken by car E (in minutes) returning from city Y to X?
(a) 526 minutes
(b) 530 minutes
(c) 576 minutes
(d) 550 minutes
(e) 612 minutes
Q15. The distance between Delhi and Gorakhpur is 762 km. Car E starts at 4 pm from Delhi towards Gorakhpur at a given speed. Another car C starts at 3.20 pm from Gorakhpur towards Delhi at a given speed. How far from Delhi both cars meet and at what time?
(a) 8:20 pm, 312 km
(b) 7:20 pm, 290 km
(c) 8:10 pm, 390 km
(d) 6:20 pm, 350 km
(e) 9.20 pm, 480 km

DIRECTIONS (16-20) : A new party XYZ, participated in election in 5 constituencies (A, B, C, D & E). Pie chart shows % distribution of party’s total votes scored by its 5 candidates and line graph shows, % of votes scored by winner candidates out of total votes polled in these 5 constituencies.
Note: All the votes must be calculated in nearest hundreds
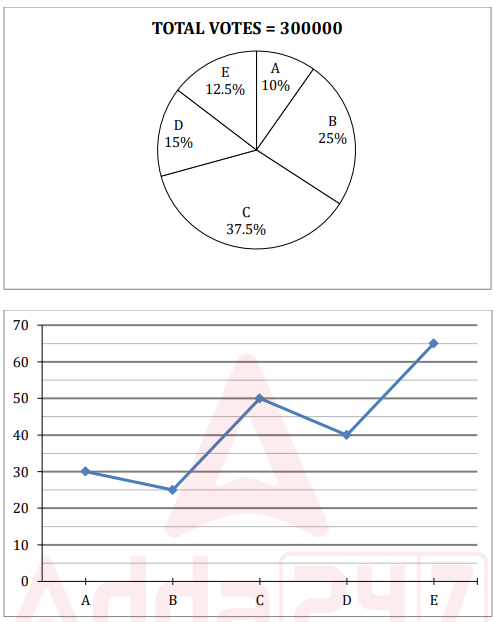
Q16. Candidate of party XYZ is winner from constituency B and defeated runner-up candidate by 7000 votes. None of the candidates from this constituency obtained vote less than 12000, then calculate maximum possible number of candidates from constituency B.
(a) 6
(b) 7
(c) 15
(d) 13
(e) can’t be determined
Q17. Party XYZ wins from constituency C. In constituency E total votes polled are 45000 less than that of constituency C. Find from how many votes the candidate of party XYZ lost in constituency E?
(a) 79500
(b) 91500
(c) 26500
(d) 27000
(e) 0
Q18. Out of constituency A and D, one of the seats was won by party XYZ. In lost constituency their candidate was runner up by 15000 votes. Find maximum possible difference between total votes polled in both of these constituencies.
(a) 50000
(b) 37500
(c) 25000
(d) either (a) or (b)
(e) either (b) or (c)
Q19. In constituencies A & E, both candidates of party XYZ are runner up, and lost by same number of votes. If the votes polled in E is 180000, find approximate number of votes polled in constituency A.
(a) 350000
(b) 365000
(c) 180000
(d) 100000
(e) None of these
Q20. Which of the following condition is never possible?
(i) constituency B and C have equal number of votes polled given that party wins from C.
(ii) candidate of party XYZ lost by 28000 voters from constituency E.
(iii) constituency A and B have equal number of votes polled.
(iv) winner candidate of constituencies B and D got equal number of votes.
(a) only (i)
(b) Only (i) and (iii)
(c) (i), (ii) and (iv)
(d) (i) and (ii)
(e) All of these are possible
SBI PO Data Interpretation- Solutions
S1. Ans.(d)
S2. Ans.(b)
S3. Ans.(a)
S4. Ans.(d)
S5. Ans.(a)
S6. Ans.(d)
S7. Ans.(e)
S8. Ans.(a)
S9. Ans.(b)
S10. Ans.(c)
S11. Ans.(b)
S12. Ans.(a)
S13. Ans.(d)
S14. Ans.(c)
S15. Ans.(a)
S16. Ans.(c)
S17. Ans.(a)
S18. Ans.(a)
S19. Ans.(b)
S20. Ans.(d)
| Related Posts | |
| SBI PO Cut Off | SBI PO Vacancy Trend of Last 5 Years |
| SBI PO Salary | SBI PO Preparation Strategy |
| SBI PO Exam Date | SBI PO Previous Year Question Papers |
| SBI PO Syllabus | SBI PO Exam Pattern |

 Data Interpretation Questions For Bank E...
 Quantitative Aptitude Quiz For Bank Main...